How to Analyze Mutual Funds Using AMFI Data (Step-by-Step Guide)

In this guide, you will learn how to analyze mutual funds using AMFI data. We’ll use Equity Mid Cap Mutual Funds as a practical example, but the same process can be applied to almost every mutual fund category available on the AMFI website.
Choosing the right mutual fund can be overwhelming. Thousands of schemes are available across categories such as Large Cap, Mid Cap, Small Cap, Flexi Cap, ELSS, and Hybrid Funds. While many websites publish “Top Mutual Fund” lists, their rankings often rely on proprietary methodologies that may emphasize recent performance or specific metrics.
A more structured approach is to analyze mutual funds using official AMFI mutual fund performance data. Since every Asset Management Company (AMC) reports standardized scheme information to AMFI, investors can compare funds on a consistent basis using verified historical performance.
In this guide, you’ll learn a simple framework for analyzing mutual funds using the AMFI Mutual Fund Scheme Performance tool. To make the process easy to follow, we’ll use Equity Mid Cap Mutual Funds as a real-world example. Once you understand the methodology, you can apply the same steps to evaluate Large Cap, Small Cap, Flexi Cap, ELSS, and several other mutual fund categories.
In this step-by-step guide, you’ll learn how to use AMFI’s Mutual Fund Scheme Performance tool to:
- Filter and compare mutual funds using official AMFI mutual fund data.
- Understand key performance metrics such as 1-year, 3-year, 5-year, and 10-year CAGR.
- Compare each fund against its benchmark instead of relying only on absolute returns.
- Shortlist high-quality mid cap funds for further analysis.
- Identify additional factors—such as rolling returns, risk-adjusted performance, expense ratio, and fund manager consistency—that can help you make a more informed investment decision.
Whether you’re investing through a Systematic Investment Plan (SIP) or a lump sum, this guide will help you build a structured framework for evaluating mutual funds instead of relying solely on popular rankings or recent performance.
- Quick Answer
- Why Use Official AMFI Data?
- Step 1: Open the AMFI Mutual Fund Scheme Performance Page
- Step 2: Apply the Right Filters (Example: Mid Cap Funds)
- Step 3: Understand the AMFI Performance Table
- Step 4: How to Compare Mutual Funds Returns with the Benchmark (The Most Important Step)
- Step 5: Shortlist the Best Funds Using a 3-Stage Screening Framework
- Step 6: Apply the Framework – Evaluating Leading Mid Cap Mutual Funds
- Step 7: Looking Beyond Past Returns – Which Funds May Be Better Positioned for the Future?
- Step 8: Common Mistakes to Avoid When Selecting a Mutual Fund
- Step 9: Evaluate Mutual Funds Beyond Returns Using Advanced Metrics
- Conclusion: Use a Process, Not a Ranking, to Select Mutual Funds
- 📖 Next Read: Further Screen Your Mutual Fund Choices
- ❓ Frequently Asked Questions (FAQs) About How to Analyze Mutual Funds
- 📚 Glossary: How to Compare Mutual Funds
- 🔍 Transparency Note: How the Funds Mentioned in This Guide Were Selected
- 💭 Final Thoughts
- 🚀 What to Read Next
Quick Answer
The best mutual fund selection process is to compare funds using official AMFI mutual fund performance data rather than relying only on third-party rankings. Start by filtering Open Ended → Equity → Mid Cap Fund in the AMFI Mutual Fund Scheme Performance tool, compare each fund’s returns with its benchmark, review long-term consistency across 5-year and 10-year periods, and then evaluate additional factors such as rolling returns, risk-adjusted performance, expense ratio, portfolio quality, and fund manager experience before making an investment decision.
Why Use Official AMFI Data?
The Association of Mutual Funds in India (AMFI) is the industry body representing SEBI-registered Asset Management Companies (AMCs). It publishes standardized mutual fund performance data submitted directly by fund houses, making it one of the most reliable sources for comparing mutual fund schemes.
Using AMFI data offers several advantages:
- Official and standardized information collected directly from Asset Management Companies.
- Uniform performance reporting, making it easier to compare similar schemes.
- Benchmark comparison, allowing you to see whether a fund has actually outperformed its benchmark index.
- Regular updates, ensuring investors have access to the latest available performance data.
- Independent analysis, enabling you to build your own shortlist instead of depending solely on third-party rankings or recommendations.
Remember, AMFI provides performance data—not investment recommendations. Its reports help you make an informed comparison, but the final investment decision should also consider your financial goals, risk tolerance, and investment horizon.
Download Free: AMFI Mutual Fund Analysis Checklist (PDF)
Use this 8-step checklist to evaluate any mutual fund before investing.
Step 1: Open the AMFI Mutual Fund Scheme Performance Page
Begin by visiting the official AMFI (Association of Mutual Funds in India) website.
From the homepage, navigate to:
Research & Innovation → Other Data → Mutual Fund Scheme Performance
Alternatively, you can access the page directly using the Mutual Fund Scheme Performance link provided below.
👉 Mutual Fund Scheme Performance ↗
This tool allows you to compare the historical performance of all SEBI-registered mutual fund schemes using standardized data reported by their respective Asset Management Companies (AMCs). It is one of the most reliable resources for screening mutual funds before conducting a deeper analysis.
🧠 Tip
Bookmark the AMFI performance page, as you’ll likely revisit it whenever you’re reviewing your portfolio or researching new mutual funds.
Step 2: Apply the Right Filters (Example: Mid Cap Funds)
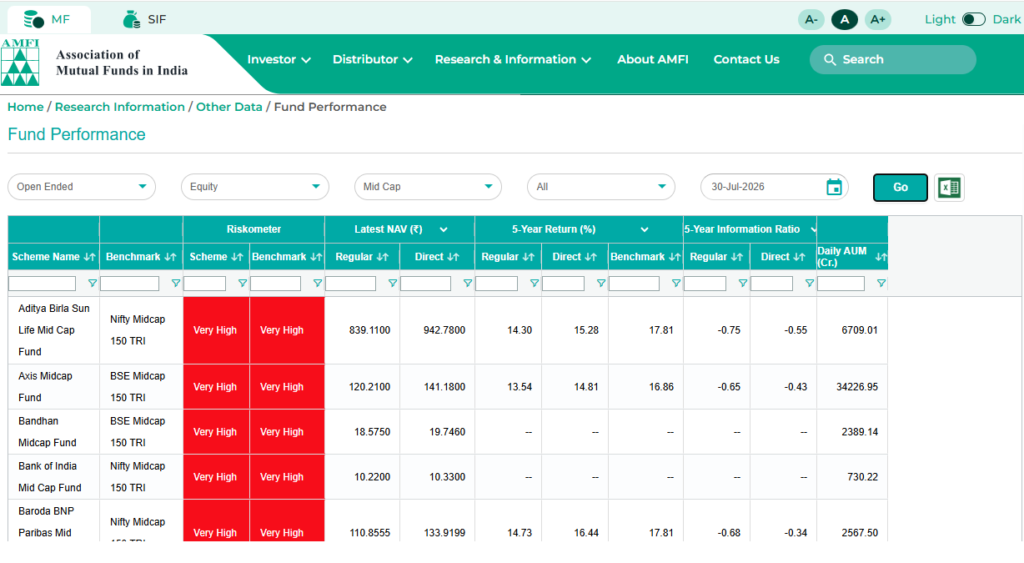
Once you open the Mutual Fund Scheme Performance page, you’ll see several filters that allow you to narrow down the list of schemes. Selecting the correct filters ensures you’re comparing funds within the same category, making your analysis fair and meaningful.
Use the following settings:
| Filter | Select |
|---|---|
| Scheme Type | Open Ended |
| Category | Equity |
| Scheme | Mid Cap Fund |
| Benchmark | All (Default) |
| Date | Latest available date |
After selecting these options, click GO.
The results page should display all Open-Ended Mid Cap Equity Mutual Funds along with their historical returns, benchmark performance, NAV, and other important metrics.
Why These Filters Matter
Understanding the purpose of each filter will help you compare the right set of mutual funds.
Scheme Type: Open Ended
Choose Open Ended because these funds allow investors to buy or redeem units on any business day at the prevailing Net Asset Value (NAV). Almost all popular SIP and long-term investment funds fall under this category.
Closed-ended funds have a fixed investment period and operate differently, so including them would make the comparison less relevant.
Category: Equity
Selecting Equity ensures that you’re comparing funds investing primarily in stocks. Since mid cap funds belong to the equity category, choosing any other category—such as Debt or Hybrid—would produce unrelated results.
Scheme: Mid Cap Fund
This is the most important filter.
Under SEBI regulations, mid-cap companies are ranked from 101st to 250th by full market capitalization. Mid cap mutual funds must invest at least 65% of their assets in these companies, giving investors exposure to businesses with the potential for higher long-term growth than large-cap companies—along with higher volatility.
By filtering specifically for Mid Cap Fund, you ensure you’re comparing funds that follow the same investment mandate.
Benchmark: All
Leave the Benchmark filter set to All.
Different fund houses use different benchmark indices, such as Nifty Midcap 150 TRI or BSE Midcap 150 TRI. Keeping this filter at its default setting allows you to compare every eligible fund regardless of the benchmark it follows.
We’ll discuss how to interpret these benchmarks in the next section.
Date: Latest Available
Always use the most recent reporting date available on the AMFI website. Mutual fund returns change regularly as markets move, so analyzing the latest data ensures your comparisons reflect current performance.
Download the Excel File (Optional but Recommended)
You’ll notice an Excel download icon in the upper-right corner of the results table.
Downloading the report makes it much easier to:
- Sort funds by 5-year or 10-year returns.
- Compare benchmark performance.
- Filter Direct and Regular plans separately.
- Perform additional analysis using Excel or Google Sheets.
We’ll use this file later in the guide to identify consistently outperforming mid cap mutual funds.
🧠 Pro Tip
Don’t compare a Mid Cap Fund with a Large Cap or Flexi Cap Fund. Each category follows different investment rules, risk profiles, and benchmark indices. Always compare funds within the same category to make meaningful investment decisions.
Step 3: Understand the AMFI Performance Table
After applying the filters, AMFI displays a performance table containing several important metrics for each mutual fund scheme.
At first glance, the table may seem overwhelming, but each column provides valuable information that can help you evaluate and compare funds more effectively.
Below are the key metrics you’ll encounter and how to interpret them.
| Metric | What It Means | Why It Matters |
|---|---|---|
| Riskometer | Indicates the fund’s risk level. | Helps you understand whether the fund matches your risk tolerance. |
| Latest NAV | The current Net Asset Value per unit. | Useful for transactions, but not for judging whether a fund is expensive or cheap. |
| 1-Year Return | Performance over the last 12 months. | Reflects recent performance but can be influenced by short-term market movements. |
| 3-Year CAGR | Annualized return over the past three years. | Provides a better picture of medium-term performance. |
| 5-Year CAGR | Annualized return over the past five years. | One of the most widely used metrics for evaluating long-term consistency. |
| 10-Year CAGR | Annualized return over the past ten years. | Shows how the fund has performed across multiple market cycles. |
| Since Inception Return | Annualized return since the fund was launched. | Useful for older funds with a long operating history. |
| Benchmark Returns | Returns of the index the fund aims to outperform. | Helps determine whether the fund has generated meaningful alpha. |
Don’t Judge a Fund by Its NAV
One of the most common misconceptions among new investors is that a fund with a lower Net Asset Value (NAV) is cheaper or has more room to grow.
This is not true.
NAV simply represents the per-unit value of the mutual fund on a given day. Unlike a company’s share price, NAV does not indicate whether a mutual fund is undervalued or overvalued.
For example, two mid cap funds may have NAVs of ₹45 and ₹450, yet both can deliver similar future returns if their portfolios perform similarly.
Focus on the fund’s quality and consistency—not its NAV.
Which Return Period Should You Focus On?
Each return period tells a different part of the fund’s story.
- 1-Year Return: Shows recent momentum but may be heavily influenced by current market conditions.
- 3-Year CAGR: Useful for evaluating how the fund has performed over the medium term.
- 5-Year CAGR: Often the best starting point for comparing established mutual funds.
- 10-Year CAGR: Indicates whether the fund has remained consistent through both bull and bear markets.
A fund that consistently performs well over 5-year and 10-year periods is generally more reliable than one that has delivered exceptional returns only in the past year.
Why Benchmark Returns Matter More Than Absolute Returns
Many investors look only at which fund has the highest return.
A better question is: Did the fund outperform its benchmark?
For example:
| Fund | 5-Year CAGR | Benchmark CAGR | Result |
|---|---|---|---|
| Fund A | 20.5% | 17.8% | Outperformed |
| Fund B | 18.9% | 17.8% | Slightly Outperformed |
| Fund C | 16.8% | 17.8% | Underperformed |
A fund that consistently beats its benchmark demonstrates its ability to generate alpha—returns above what the market index delivered after accounting for its investment strategy.
This is often a stronger indicator of fund management quality than absolute returns alone.
We’ll explore benchmark comparisons in more detail in the next step.
Direct vs Regular Plans
You’ll usually notice that the same mutual fund appears twice in the AMFI report:
- Direct Plan
- Regular Plan
The underlying portfolio is the same, but the expense ratio differs.
Since Direct Plans have lower expenses, they generally deliver slightly higher returns over time than Regular Plans.
When comparing mutual funds, always compare:
- Direct Plan vs Direct Plan
- Regular Plan vs Regular Plan
Comparing a Direct Plan with a Regular Plan can lead to misleading conclusions because the difference in returns is primarily due to costs, not investment performance.
✅ Key Takeaway
At this stage, don’t worry about selecting a winner. Your objective is to understand what each metric represents and identify the funds that have demonstrated consistent performance over multiple time periods.
In the next step, you’ll learn how to compare each fund against its benchmark—a crucial step that many investors overlook when choosing a mutual fund.
Step 4: How to Compare Mutual Funds Returns with the Benchmark (The Most Important Step)
Comparing mutual fund returns with the benchmark is one of the most important steps in mutual fund analysis.
If you remember only one concept from this guide, make it this:
A mutual fund should not only generate good returns—it should consistently outperform its benchmark.
Many investors compare one mutual fund with another and simply choose the one with the highest return. However, professional fund analysis begins with a different question:
Did the fund add value beyond what the market itself delivered?
That’s exactly what the benchmark helps you measure.
What Is a Benchmark?
Every equity mutual fund is assigned a benchmark index that reflects the type of companies it invests in. This benchmark serves as the fund’s performance yardstick.
For most mid cap mutual funds, the benchmark is one of the following:
- Nifty Midcap 150 TRI
- BSE Midcap 150 TRI
These indices track the performance of a basket of mid-cap companies and represent the market segment in which the fund invests.
The fund manager’s objective is not merely to match the benchmark but to outperform it over the long term, after accounting for expenses and market conditions.
Why AMFI Shows Different Benchmark Returns
When you review the AMFI performance report, you may notice that not every mid cap fund is compared against the same benchmark.
For example:
| Benchmark | Example 5-Year CAGR* |
|---|---|
| Nifty Midcap 150 TRI | 17.8% |
| BSE Midcap 150 TRI | 16.9% |
*Figures are for illustration only and will vary depending on the reporting date.
This difference exists because each Asset Management Company selects a benchmark that best aligns with the fund’s investment objective, subject to applicable regulations.
As a result, always compare a fund against its own benchmark, not against the benchmark used by another fund.
What Does It Mean to Beat the Benchmark?
Suppose two funds report the following 5-year performance:
| Fund | 5-Year CAGR | Benchmark | Result |
|---|---|---|---|
| Fund A | 20.4% | 17.8% | Outperformed by 2.6% |
| Fund B | 18.5% | 17.8% | Outperformed by 0.7% |
| Fund C | 16.9% | 17.8% | Underperformed |
Fund A has generated the highest excess return over its benchmark, while Fund C has failed to keep pace with the market index.
This excess return is commonly referred to as alpha.
Simply put:
Alpha is the additional return a fund manager generates over the benchmark after making investment decisions.
A fund that consistently delivers positive alpha over many years demonstrates the potential for skilled and disciplined portfolio management.
Don’t Chase the Highest Return
A common mistake is to select the fund showing the highest 5-year return without considering the benchmark.
Imagine these two scenarios:
| Fund | Fund Return | Benchmark Return | Difference |
|---|---|---|---|
| Fund X | 21.0% | 20.8% | +0.2% |
| Fund Y | 19.5% | 16.5% | +3.0% |
At first glance, Fund X appears to be the better performer because its absolute return is higher.
However, Fund Y has added significantly more value relative to the market it was expected to track.
This is why experienced investors look beyond headline returns and evaluate how effectively a fund has outperformed its benchmark.
Consistency Matters More Than One Exceptional Year
A single year of strong performance doesn’t necessarily indicate a superior mutual fund.
Instead, look for funds that have consistently outperformed their benchmark across multiple time periods, such as:
- 3-Year CAGR
- 5-Year CAGR
- 10-Year CAGR
- Different market cycles (bull and bear markets)
Consistent outperformance suggests that the fund’s investment process may be repeatable rather than driven by short-term market trends.
Direct Plans vs Regular Plans
When comparing benchmark performance, ensure you’re comparing like with like.
A Direct Plan typically reports slightly higher returns than a Regular Plan because it has a lower expense ratio—not because it holds different investments.
Always compare:
- Direct Plan with Direct Plan
- Regular Plan with Regular Plan
This keeps your analysis fair and avoids drawing incorrect conclusions.
A Few Things to Keep in Mind
While benchmark comparison is one of the most useful screening tools, it shouldn’t be the only factor in your decision.
Also consider:
- Whether the fund outperformed the benchmark consistently, not just once.
- The level of risk taken to achieve those returns.
- Performance across different market conditions.
- Expense ratio and portfolio quality.
- The fund manager’s investment process and track record.
We’ll examine these factors later in the guide.
✅ Key Takeaway
The objective isn’t to find the mutual fund with the highest historical return—it’s to identify funds that have consistently created value beyond their benchmark over the long term.
Benchmark comparison helps separate returns driven primarily by a rising market from returns generated through effective fund management. Combined with risk analysis and long-term consistency, it provides a much stronger foundation for selecting a mutual fund.
Step 5: Shortlist the Best Funds Using a 3-Stage Screening Framework
For this guide, we’ll continue using Mid Cap Funds as our example. If you’re analyzing Large Cap, Small Cap, Flexi Cap, or ELSS funds, simply select the corresponding scheme category in the AMFI filters and follow the same screening process.
By now, you’ve filtered the AMFI data and learned how to compare each fund against its benchmark. The next step is to narrow the list into a handful of high-quality candidates for deeper analysis.
Rather than choosing the fund with the highest return, use the following three-stage screening framework to identify funds that combine performance, consistency, and quality.
Stage 1: Performance Filter
Start by evaluating historical performance.
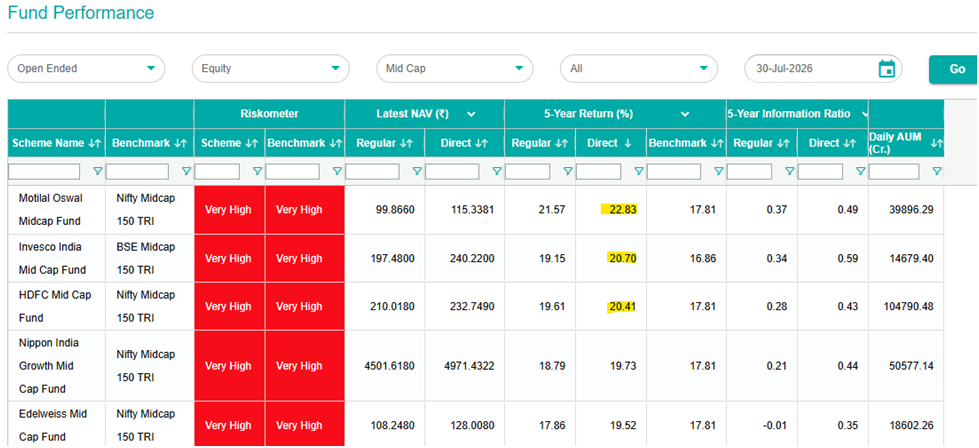
Sort the 5-Year CAGR column in descending order and identify the top-performing funds. Then compare their 10-Year CAGR (where available) to determine whether their strong performance has been sustained over a longer period.
At this stage, eliminate funds that:
- Consistently underperform their benchmark.
- Have significantly weaker long-term returns than their peers.
- Show strong short-term performance but lack a convincing long-term track record.
🧠 Pro Tip:
A fund that ranks fourth or fifth today may ultimately prove to be a better long-term investment than the current top-ranked fund if its performance has been more consistent across market cycles.
Stage 2: Consistency Filter
Past returns are useful, but consistency is even more important.
A fund that performs well across different market environments is generally more reliable than one that delivers exceptional returns during a single bull market.
Look for funds that demonstrate:
- Consistent performance across 3-year, 5-year, and 10-year periods.
- Regular outperformance of their benchmark.
- Competitive rolling returns over multiple investment periods.
- Better downside protection during market corrections.
This stage helps distinguish genuinely consistent funds from those benefiting from short-term market trends.
Stage 3: Quality Filter
Once you’ve narrowed your list based on performance and consistency, evaluate the qualitative factors that can influence future performance.
Consider:
Expense Ratio
Lower expenses leave more of the investment return in the hands of investors. Over long investment horizons, even small differences in expense ratios can have a meaningful impact on wealth creation.
Fund Manager Experience
A stable and experienced fund management team often indicates a disciplined and repeatable investment process. Frequent changes in fund managers may warrant additional review.
Portfolio Quality
Examine the fund’s portfolio to understand:
- Sector allocation
- Top holdings
- Diversification
- Stock selection strategy
This provides insight into how the fund generates returns and whether its investment style aligns with your expectations.
Assets Under Management (AUM)
AUM reflects the size of the fund.
While a larger AUM can indicate investor confidence, extremely large mid cap funds may face operational challenges when investing in smaller companies due to liquidity constraints. Conversely, a very small AUM may raise questions about scale and long-term viability.
AUM should be viewed as one factor among many—not as a standalone indicator of quality.
Risk Metrics
Historical returns tell you how much a fund earned.
Risk metrics help explain how those returns were achieved.
Examples include:
- Sharpe Ratio
- Sortino Ratio
- Standard Deviation
- Beta
- Maximum Drawdown
We’ll cover these metrics in more detail later in this guide.
Download the Excel Report for Better Analysis
Although the AMFI website allows you to sort the data online, downloading the Excel file provides much greater flexibility.
With the Excel report, you can:
- Sort funds by different return periods.
- Separate Direct and Regular Plans.
- Compare benchmark performance.
- Identify consistently outperforming funds.
- Build your own shortlist for further research.
If you’re evaluating several mutual funds, working with the Excel file can save time and make comparisons much easier.
Your Goal at This Stage
By the end of this screening process, you should have a shortlist of three to five mid cap mutual funds that satisfy the following criteria:
✅ Consistently outperform their benchmark.
✅ Strong 5-year and, where available, 10-year performance.
✅ Demonstrate reasonable consistency across different market cycles.
✅ Have experienced fund management and a clear investment approach.
✅ Align with your investment horizon and risk tolerance.
Remember, this shortlist is not your final investment decision. It simply identifies the most promising candidates for a more detailed evaluation using rolling returns, risk-adjusted performance, portfolio analysis, and other qualitative factors.
📌 Remember This
Think of this process like hiring for an important role. The AMFI data helps you create a shortlist of qualified candidates. Before making the final selection, you still need to conduct a deeper assessment of each fund’s strengths, risks, and long-term suitability.
Step 6: Apply the Framework – Evaluating Leading Mid Cap Mutual Funds
Now that you’ve learned how to screen mutual funds using official AMFI data, let’s apply the same framework to a real-world example.
The table below illustrates how some of the leading Direct Growth Mid Cap Mutual Funds compare based on recent AMFI performance data. The figures are illustrative and should be updated periodically using the latest AMFI report.
| Fund | 5-Year CAGR* | 10-Year CAGR* | What Stands Out |
|---|---|---|---|
| Motilal Oswal Mid Cap Fund | ~22.83% | ~17.4% | Exceptional recent performance with a concentrated investment strategy. |
| Invesco India Mid Cap Fund | ~20.70% | ~19.9% | Strong long-term consistency across multiple market cycles. |
| HDFC Mid Cap Opportunities Fund | ~20.41% | ~18.2% | Diversified portfolio with a disciplined investment process. |
| Nippon India Growth Fund | ~19.73% | ~18.9% | Long track record and consistent benchmark outperformance. |
| Edelweiss Mid Cap Fund | ~19.52% | ~19.5% | Good balance between return generation and downside protection. |
| Quant Mid Cap Fund | ~16.7% | ~18.5% | Distinct investment style that has produced periods of both strong outperformance and higher volatility. |
*Returns are approximate annualized CAGR values based on a recent AMFI report and will vary as market conditions change.
What the Data Suggests
Rather than asking, “Which fund has the highest return?”, use the screening framework from the previous step to identify patterns.
Stage 1: Performance
Several funds have delivered strong 5-year returns, indicating that they have participated well in the recent market cycle.
However, a high recent return should be viewed as the starting point for analysis—not the final decision.
Stage 2: Consistency
When you extend the analysis to 10-year performance (where available), a different picture may emerge.
Some funds that rank near the top over five years have more moderate long-term returns, while others have maintained strong performance over an entire market cycle.
This highlights why investors should consider multiple time horizons instead of relying solely on recent performance.
Stage 3: Quality
The final stage is to understand how each fund achieved its returns.
For example:
- Motilal Oswal Mid Cap Fund has historically followed a relatively concentrated investment approach, which has led to periods of strong outperformance but may also result in greater short-term volatility.
- Invesco India Mid Cap Fund has demonstrated long-term consistency, making it an interesting candidate for investors who value stability across different market environments.
- HDFC Mid Cap Opportunities Fund has generally maintained a diversified portfolio and a disciplined investment process, contributing to its long-term track record.
- Nippon India Growth Fund has consistently remained among the better-performing mid cap funds over extended periods while following an established investment approach.
- Edelweiss Mid Cap Fund has built a reputation for balancing return generation with risk management, making it worth evaluating alongside higher-return peers.
- Quant Mid Cap Fund follows a distinctive investment strategy that has delivered strong results during certain market phases but has also experienced periods of higher volatility. Investors should assess whether this style aligns with their own risk tolerance.
Don’t Focus on Rankings Alone
A fund ranked first today may not remain at the top next year.
Market leadership changes as sectors, investment styles, and economic conditions evolve.
Instead of chasing the latest winner, focus on identifying funds that demonstrate:
- Consistent benchmark outperformance.
- Strong long-term performance across multiple market cycles.
- A clearly defined and repeatable investment process.
- Reasonable risk relative to the returns generated.
These characteristics are often more important than a temporary lead in the performance rankings.
Your Shortlist
Based on the three-stage screening framework, your objective should be to create a shortlist of three to five funds that satisfy most of the following criteria:
- Strong 5-year and, where available, 10-year performance.
- Consistent outperformance of their benchmark.
- Experienced and stable fund management.
- A portfolio construction approach that aligns with your investment goals.
- An expense ratio and risk profile that you are comfortable with.
Once you’ve prepared this shortlist, you’re ready for the final stage of analysis: evaluating risk-adjusted performance, rolling returns, portfolio quality, and other factors that provide deeper insight into a fund’s future potential.
Step 7: Looking Beyond Past Returns – Which Funds May Be Better Positioned for the Future?
Historical returns are an important starting point, but they tell only part of the story.
A fund that delivered the highest returns over the past five years isn’t guaranteed to remain the top performer over the next five. Markets evolve, sectors rotate, fund managers change, and investment styles go in and out of favor.
Instead of trying to predict the next winner, focus on identifying funds with characteristics that have historically supported long-term performance.
What Makes a Mutual Fund More Likely to Succeed Over the Long Term?
When comparing your shortlisted funds, consider the following factors in addition to trailing returns.
1. Consistent Performance Across Market Cycles
Markets move through periods of expansion, correction, recovery, and consolidation.
A fund that has delivered competitive returns through multiple market cycles often demonstrates a disciplined investment process rather than benefiting from a single favorable period.
Look for consistency across:
- 3-Year CAGR
- 5-Year CAGR
- 10-Year CAGR
- Bull and bear markets
2. Experienced and Stable Fund Management
A mutual fund’s investment strategy is implemented by its fund manager and investment team.
While no manager outperforms every year, a stable team with a clearly defined investment philosophy can contribute to greater consistency over the long term.
When researching a fund, consider:
- Fund manager tenure.
- Changes in portfolio management.
- Whether the investment philosophy has remained consistent over time.
3. Portfolio Quality
Two funds may deliver similar historical returns while holding very different portfolios.
Review the fund’s portfolio to understand:
- Top holdings.
- Sector allocation.
- Diversification.
- Concentration in individual stocks.
- Overall investment approach.
This helps you determine whether the fund’s strategy aligns with your own investment objectives and risk tolerance.
4. Risk Management
Higher returns are valuable only if the level of risk is appropriate.
A fund that generates slightly lower returns while experiencing significantly smaller drawdowns during market corrections may be a better long-term choice for many investors.
Useful risk measures include:
- Sharpe Ratio
- Sortino Ratio
- Maximum Drawdown
- Standard Deviation
- Beta
We’ll discuss these metrics in more detail later in this guide.
5. Expense Ratio
The expense ratio is the annual fee charged for managing the fund.
Although the difference between two funds may appear small, lower costs can improve long-term returns through the power of compounding.
When comparing funds with similar investment styles and performance, the expense ratio is an important consideration.
6. Fund Size (AUM)
Assets Under Management (AUM) provide insight into the size of a mutual fund.
A very small fund may face operational challenges, while an extremely large mid cap fund may have reduced flexibility when buying or selling smaller companies.
AUM should therefore be viewed alongside other factors rather than as an indicator of quality by itself.
Applying These Principles to Leading Mid Cap Funds
Using the framework developed in this guide, here’s how some well-known mid cap funds stand out based on their publicly available characteristics.
Motilal Oswal Midcap Fund, Invesco India Mid Cap Fund, and Edelweiss Mid Cap Fund emerge as the top contenders across both 5-year and 10-year horizons, with Invesco India being recognized as the single most consistent performer across multiple market cycles.
Nippon India Growth Fund: Long-term Track Record
Often recognized for:
- Long operating history.
- Consistent benchmark outperformance.
- Experienced fund management.
- Diversified portfolio across sectors.
Suitable for investors looking for a fund with an established long-term track record.
HDFC Mid Cap Opportunities Fund: Broad Diversification
Known for:
- Disciplined investment process.
- Broad portfolio diversification.
- Strong long-term history.
- Relatively steady performance across market cycles.
Often considered by investors seeking long-term wealth creation through SIPs.
The AUM Curse: Funds like HDFC Mid Cap handle over ₹1 Lakh Crore. Managing a massive asset pool makes it difficult for fund managers to enter and exit smaller, high-growth midcap companies without moving stock prices against themselves
Invesco India Mid Cap Fund: Stabile and Balanced Portfolio
It is the only fund to consistently sit at the peak of 3, 5, and 10-year SIP return tables across varying bull and bear cycles.
Notable for:
- Consistent long-term returns.
- Balanced portfolio construction.
- Stable investment approach.
- Strong historical performance across different market environments.
Frequently appears among funds with competitive long-term performance.
Best for: Investors looking for steady wealth creation without extreme portfolio volatility.
Motilal Oswal Mid Cap Fund: The Alpha Aggressor
Focuses on a high-conviction, low-diversification model. If its core sectoral bets pay off, it vastly outpaces the benchmark.
Distinguished by:
- Concentrated portfolio.
- High-conviction investment strategy.
- Strong participation during favorable market phases.
Investors should also recognize that a more concentrated approach may result in greater short-term volatility.
Suitable for: Aggressive investors who want to maximize absolute returns and can tolerate short-term volatility.
Edelweiss Mid Cap Fund: The Risk-Adjusted Fund
Boasts a solid Sortino ratio and a beta below 1.0 (~0.94). This implies it captures market upside while declining much less than its peers during market corrections.
Often appreciated for:
- Balanced investment approach.
- Competitive long-term performance.
- Focus on managing downside risk alongside return generation.
Worth evaluating alongside larger and more established peers.
Suitable for: Conservative long-term equity investors worried about midcap market crashes.
The New Horizon Entrants
Exceptional 5-year funds like Mahindra Manulife Mid Cap or WhiteOak Capital Mid Cap lack a 10-year track record. They are performing phenomenally now but haven’t been tested through a true decade-long economic recession.
There Is No Single “Best” Mutual Fund
One of the biggest lessons from analyzing AMFI data is that the top-performing fund changes over time.
A fund leading the rankings today may be overtaken in the coming years as market conditions, sectors, and investment styles evolve.
Instead of searching for the perfect fund, aim to identify funds that consistently demonstrate:
- A disciplined investment process.
- Long-term benchmark outperformance.
- Sensible portfolio construction.
- Effective risk management.
- Stability across different market cycles.
These qualities are often more valuable than simply choosing the fund with the highest recent return.
✅ Key Takeaway
Past performance provides useful evidence, but it is not a guarantee of future results.
The most effective approach is to combine historical performance with qualitative analysis. By evaluating consistency, portfolio quality, risk management, expense ratio, and fund management alongside AMFI performance data, you’ll be in a much stronger position to build a shortlist of mutual funds that align with your long-term investment objectives.
Step 8: Common Mistakes to Avoid When Selecting a Mutual Fund
Analyzing mutual funds using AMFI data is a disciplined approach, but selecting a suitable fund requires more than just finding a scheme with the highest return.
Many investors make avoidable mistakes by focusing on a single metric or following short-term trends. Understanding these common mistakes can help you make better investment decisions.
Mistake 1: Selecting a Fund Only Because It Has the Highest Recent Return
One of the most common mistakes is choosing the mutual fund that appears at the top of the 1-year or 3-year return chart.
While strong recent performance is worth studying, it does not necessarily indicate future success.
A fund may rank highly because of:
- A favorable market cycle.
- Strong performance in a particular sector.
- Temporary market conditions.
- A specific investment style that is currently in favor.
Instead, evaluate performance across multiple periods:
- 3-year CAGR.
- 5-year CAGR.
- 10-year CAGR (where available).
- Performance during different market phases.
Consistency is usually more valuable than a temporary position at the top of the rankings.
Mistake 2: Ignoring Benchmark Performance
A fund generating 18% returns may appear attractive, but the important question is:
How much value did the fund add compared to its benchmark?
If the benchmark generated 17.5%, the fund has added limited value despite a strong-looking return.
Always compare:
- Fund return versus benchmark return.
- Performance consistency versus benchmark.
- Risk taken to generate excess returns.
A good mutual fund should ideally demonstrate the ability to outperform its benchmark over meaningful periods.
Mistake 3: Comparing Direct Plans with Regular Plans
Direct and Regular Plans of the same mutual fund invest in the same portfolio, but their expense structures are different.
Direct Plans have lower expense ratios because they do not include distributor commissions. Therefore, their returns are generally slightly higher over long periods.
Avoid comparing:
❌ Direct Plan vs Regular Plan
Instead compare:
✅ Direct Plan vs Direct Plan
or
✅ Regular Plan vs Regular Plan
This ensures a fair comparison.
Mistake 4: Assuming a Lower NAV Means a Cheaper Fund
Many new investors believe that a mutual fund with a lower NAV has more growth potential than a fund with a higher NAV.
This is incorrect.
NAV only represents the per-unit value of the fund. It does not indicate whether the fund is expensive or undervalued.
For example:
- Fund A NAV: ₹50
- Fund B NAV: ₹500
The fund with the lower NAV is not automatically cheaper or better positioned to deliver higher returns.
Investment decisions should be based on portfolio quality, performance, risk, and consistency—not NAV.
Mistake 5: Ignoring Risk While Looking at Returns
Returns tell you how much a fund earned.
They do not tell you how much volatility or risk was involved in generating those returns.
Two funds may have similar returns, but one may have experienced much larger declines during market corrections.
Consider evaluating:
- Sharpe Ratio.
- Sortino Ratio.
- Maximum Drawdown.
- Standard Deviation.
- Beta.
Understanding risk-adjusted returns provides a more complete picture of fund quality.
Mistake 6: Investing in Too Many Similar Funds
Many investors build portfolios by adding multiple funds that appear attractive individually.
However, owning several funds from the same category may not provide meaningful diversification if they hold similar stocks.
Before adding another fund, check:
- Portfolio overlap.
- Common top holdings.
- Sector concentration.
- Investment style.
Sometimes one carefully selected fund may provide better diversification than several similar schemes.
Mistake 7: Ignoring Investment Horizon
Equity mutual funds, especially mid-cap funds, are designed for long-term investors.
Short-term market movements can be unpredictable.
Before investing, consider whether your investment horizon matches the fund category.
For example:
- Equity funds generally require a longer investment horizon.
- Mid-cap funds may experience higher volatility compared to large-cap funds.
- Investors should be prepared to stay invested through market cycles.
Mistake 8: Changing Funds Frequently Based on Short-Term Performance
A fund underperforming for a few months does not automatically mean it has failed.
Investment strategies may temporarily lag when certain sectors or styles are out of favor.
Before replacing a fund, evaluate:
- Whether the investment philosophy has changed.
- Whether the fund continues to follow its stated strategy.
- Whether long-term performance remains competitive.
- Whether there are significant changes in management.
Frequent switching based on recent rankings can reduce the benefits of long-term investing.
A Simple Checklist Before Investing
Before selecting any mutual fund, download this checklist and evaluate your shortlisted funds using the same process.
Before finalizing any mutual fund, ask:
✅ Has the fund consistently performed well over multiple periods?
✅ Has it generated returns above its benchmark?
✅ Is the investment strategy clear and consistent?
✅ Are the risks acceptable for my investment horizon?
✅ Is the expense ratio reasonable?
✅ Does the fund complement my existing portfolio?
If the answer to these questions is positive, the fund deserves further consideration.
✅ Key Takeaway
Selecting a mutual fund is not about finding yesterday’s winner. It is about identifying funds with a strong investment process, consistent performance, and characteristics that can support long-term wealth creation.
Using AMFI data as the starting point and combining it with deeper analysis can help investors make decisions based on evidence rather than short-term market excitement.
Step 9: Evaluate Mutual Funds Beyond Returns Using Advanced Metrics
Historical returns are the easiest way to compare mutual funds, but they do not provide a complete picture.
Two funds may generate similar returns while having very different levels of risk. One fund may achieve returns through a consistent investment process, while another may experience large ups and downs to achieve the same outcome.
To understand the quality of a mutual fund’s performance, investors should evaluate additional factors such as rolling returns, risk-adjusted ratios, portfolio characteristics, and fund management stability.
1. Rolling Returns: Measuring Consistency
Rolling returns are one of the most useful tools for evaluating mutual funds because they show performance across multiple periods instead of measuring only one fixed timeframe.
For example, a 5-year return calculated today tells you how the fund performed during one specific 5-year period.
A 5-year rolling return analysis calculates multiple 5-year periods:
- January 2018 to January 2023
- February 2018 to February 2023
- March 2018 to March 2023
- And so on
This provides a much clearer picture of whether the fund has consistently delivered competitive returns.
Why Rolling Returns Matter
A fund may appear attractive because of one exceptional period.
However, a fund with strong rolling returns demonstrates:
- More consistent performance.
- Better ability to handle different market conditions.
- A more repeatable investment process.
When comparing mutual funds, look for schemes that consistently rank well across rolling return periods rather than only having the highest trailing return.
2. Sharpe Ratio: Understanding Return Relative to Risk
The Sharpe Ratio measures how much return a fund generated for the amount of risk taken.
In simple terms, a higher Sharpe Ratio means the fund generated better returns for the level of volatility experienced.
For example:
- Fund A and Fund B both deliver 15% annual returns.
- Fund A experiences much lower volatility.
- Fund B experiences large price swings.
Fund A would generally have a better risk-adjusted performance because investors received similar returns with less uncertainty.
How Investors Can Use It
When comparing similar mutual funds:
- A higher Sharpe Ratio is generally preferable.
- Compare funds within the same category.
- Avoid using this metric alone without considering investment style and market conditions.
3. Sortino Ratio: Measuring Downside Risk
The Sortino Ratio is similar to the Sharpe Ratio, but it focuses specifically on harmful volatility.
Not all price movements are equally concerning.
For investors, a temporary rise or fall may not matter, but large declines during market corrections can affect long-term wealth creation.
The Sortino Ratio evaluates:
- Returns generated.
- Compared with downside fluctuations.
A fund with a higher Sortino Ratio has historically delivered better returns while controlling negative movements.
This metric is particularly useful for investors who want equity exposure but are concerned about large drawdowns.
4. Maximum Drawdown: How Much Can a Fund Fall?
Maximum Drawdown measures the largest decline a fund experienced from its peak value before recovering.
For example:
- A mutual fund grows from ₹10 lakh to ₹15 lakh.
- During a market correction, it falls to ₹11 lakh.
- The decline from ₹15 lakh to ₹11 lakh represents the drawdown.
Understanding drawdowns helps investors answer an important question:
“Can I stay invested when the fund experiences a major decline?”
A fund with slightly lower returns but significantly smaller drawdowns may be easier for many investors to hold through difficult market periods.
5. Standard Deviation: Measuring Volatility
Standard deviation indicates how much a fund’s returns fluctuate around its average return.
A higher standard deviation generally means:
- Greater price movement.
- Higher uncertainty.
- Larger short-term fluctuations.
Mid-cap funds naturally tend to have higher volatility than large-cap funds because mid-sized companies are more sensitive to economic cycles and market sentiment.
However, volatility should not automatically be viewed as negative.
The key question is: Is the additional risk being rewarded with better long-term returns?
6. Portfolio Overlap: Avoiding Hidden Concentration
Investors often buy multiple mutual funds believing they are increasing diversification.
However, two or three funds may own many of the same companies.
For example:
Fund A and Fund B may both have significant exposure to:
- The same top 10 stocks.
- Similar sectors.
- Similar investment themes.
In such cases, owning multiple funds may provide less diversification than expected.
Before adding a new fund, review:
- Top holdings.
- Sector allocation.
- Portfolio overlap percentage.
A smaller number of carefully selected funds may sometimes provide better diversification than a large collection of similar schemes.
7. Fund Manager Stability and Investment Process
A mutual fund’s past performance is linked not only to market conditions but also to the investment decisions made by the fund management team.
When evaluating a fund, consider:
- How long the current fund manager has managed the scheme.
- Whether there have been frequent changes in the investment team.
- Whether the fund continues to follow its stated investment philosophy.
A stable and clearly defined process can be an important advantage over the long term.
How to Combine These Metrics
No single metric can identify the “best” mutual fund.
A balanced evaluation combines:
| Factor | What It Helps You Understand |
|---|---|
| CAGR | Historical wealth creation |
| Benchmark comparison | Ability to generate alpha |
| Rolling returns | Consistency |
| Sharpe Ratio | Return versus volatility |
| Sortino Ratio | Downside risk management |
| Maximum Drawdown | Loss potential during corrections |
| Expense Ratio | Cost impact |
| Portfolio Analysis | Investment quality |
| Fund Management | Process stability |
The objective is not to find a fund that scores highest in every category. Instead, look for a fund where the overall combination of return, risk, and consistency matches your investment goals.
✅ Key Takeaway
Returns tell you what happened.
Advanced metrics help explain how it happened.
By combining AMFI performance data with rolling returns, risk-adjusted ratios, portfolio analysis, and qualitative factors, investors can move beyond simple rankings and develop a more structured approach to selecting mutual funds.
Conclusion: Use a Process, Not a Ranking, to Select Mutual Funds
Selecting a mutual fund should not be based on a single number, a recent performance chart, or a popular ranking list.
The best approach is to follow a structured evaluation process using reliable data sources.
AMFI provides investors with a powerful starting point by offering standardized mutual fund performance information reported by Asset Management Companies. By using this data correctly, investors can compare funds objectively and avoid many common mistakes.
This framework helps investors analyze mutual funds systematically rather than depending on rankings.
The complete process can be summarized as:
Step 1: Start With Official Data
Use AMFI’s Mutual Fund Scheme Performance tool instead of relying only on third-party rankings.
Step 2: Apply the Correct Filters
Select the appropriate mutual fund category and compare schemes within the same segment.
For this guide, we used Equity Mid Cap Funds as an example, but the same approach can be applied to other categories.
Step 3: Compare More Than Just Returns
Evaluate:
- 3-year, 5-year, and 10-year CAGR.
- Benchmark performance.
- Rolling returns.
- Risk-adjusted metrics.
Step 4: Understand How Returns Were Generated
Look beyond performance numbers and analyze:
- Portfolio quality.
- Fund manager experience.
- Investment philosophy.
- Expense ratio.
- Risk management approach.
Step 5: Build a Shortlist, not a Quick Decision
The objective is not to immediately invest in the highest-ranked fund.
The objective is to identify a few high-quality funds that deserve deeper analysis and align with your investment goals.
📖 Next Read: Further Screen Your Mutual Fund Choices
AMFI data provides a strong starting point, but it shouldn’t be the final step in your selection process. To refine your shortlist, compare funds using advanced metrics such as rolling returns, consistency scores, risk-adjusted performance, portfolio quality, sector allocation, and fund manager track records. Platforms like Value Research Online offer detailed fund analysis, peer comparisons, and screening tools that can help you identify mutual funds aligned with your investment goals and risk tolerance.
👉 Read Next: Learn How to Screen Mutual Funds Further on Value Research Online
❓ Frequently Asked Questions (FAQs) About How to Analyze Mutual Funds
What is AMFI Mutual Fund Scheme Performance?
AMFI Mutual Fund Scheme Performance is a tool provided by the Association of Mutual Funds in India that allows investors to view and compare historical performance data of mutual fund schemes.
The data includes information such as NAV, returns over different periods, benchmark performance, and other scheme details reported by Asset Management Companies (AMCs).
AMFI provides standardized performance information, but it does not recommend or rank mutual funds.
How can I compare mutual funds using AMFI data?
To compare mutual funds using AMFI data:
1. Select the appropriate scheme category.
2. Filter funds based on your requirement, such as Mid Cap, Large Cap, Small Cap, or Flexi Cap.
3. Compare returns across multiple periods such as 3-year, 5-year, and 10-year CAGR.
4. Check whether the fund has consistently outperformed its benchmark.
5. Evaluate additional factors such as rolling returns, risk metrics, expense ratio, and portfolio quality.
AMFI data should be used as the starting point for analysis rather than the only factor in an investment decision.
Why should I compare a mutual fund with its benchmark?
A benchmark provides a reference point to evaluate whether a mutual fund has added value through its investment strategy.
For example, a mid-cap fund should ideally be compared with a suitable mid-cap index rather than only comparing it with other funds.
A fund that consistently outperforms its benchmark over long periods demonstrates stronger evidence of effective fund management.
Is a higher 5-year return enough to select a mutual fund?
Not always.
A high 5-year return is useful for identifying potential candidates, but it should not be the only selection criteria.
Investors should also evaluate:
– 10-year performance (where available).
– Benchmark outperformance.
– Rolling returns.
– Risk-adjusted returns.
– Portfolio quality.
– Fund management stability.
A fund with slightly lower returns but better consistency and lower risk may be more suitable for many investors.
Which benchmark is used for mid cap mutual funds?
Mid cap mutual funds commonly use benchmarks such as: Nifty Midcap 150 TRI, and BSE Midcap 150 TRI. The benchmark used depends on the fund house and the scheme’s investment objective.
When analyzing a fund, compare it against its own benchmark rather than assuming all mid cap funds use the same index.
Should I choose Direct or Regular mutual funds?
Direct and Regular Plans of the same mutual fund invest in the same portfolio, but they have different expense structures.
Direct Plans generally have lower expenses because they do not include distributor commissions. Over long periods, this difference can affect returns.
Investors should compare:
– Direct Plan with Direct Plan.
– Regular Plan with Regular Plan.
The choice between Direct and Regular depends on whether an investor wants to manage investments independently or prefers professional distribution and guidance services.
How often does AMFI update mutual fund performance data?
AMFI regularly updates mutual fund scheme performance data based on information submitted by Asset Management Companies.
Since mutual fund returns change with market movements, investors should always check the latest available report before comparing schemes.
Which mid cap mutual funds have consistently performed well?
The answer changes over time because mutual fund rankings are dynamic.
Instead of focusing only on the current top-performing fund, investors should identify schemes that demonstrate:
– Long-term benchmark outperformance.
– Consistent rolling returns.
– A stable investment process.
– Effective risk management.
A disciplined evaluation framework is more reliable than selecting funds based only on current rankings.
Are past mutual fund returns guaranteed to continue in the future?
No.
Past performance can provide useful information about a fund’s investment process and historical behavior, but it does not guarantee future returns.
Future performance depends on several factors, including:
– Market conditions.
– Portfolio decisions.
– Economic cycles.
– Fund management quality.
– Valuations.
Investors should use historical data as one part of their research process.
How many mutual funds should I shortlist before investing?
There is no fixed number, but creating a shortlist of around three to five funds for detailed analysis is usually practical.
After shortlisting, compare:
– Performance consistency.
– Benchmark returns.
– Risk metrics.
– Portfolio overlap.
– Investment strategy.
The goal is not to collect many funds but to identify schemes that fit your investment objectives.
Can this AMFI-based analysis method be used for other mutual fund categories?
Yes.
The same framework can be applied to other categories such as:
– Large Cap Funds.
– Small Cap Funds.
– Flexi Cap Funds.
– ELSS Funds.
– Multi Cap Funds.
– Hybrid Funds.
The filters and evaluation metrics may vary depending on the category, but the overall approach remains the same:
Collect official data → Compare performance → Evaluate risk → Understand portfolio quality → Make an informed decision.
Is AMFI data enough to select a mutual fund?
AMFI data is an excellent starting point because it provides standardized performance information, but it should not be the only consideration.
A complete evaluation should also include:
→ Investment objective.
→ Risk profile.
→ Portfolio analysis.
→ Expense ratio.
→ Fund manager experience.
→ Your own financial goals and investment horizon.
📚 Glossary: How to Compare Mutual Funds
1. AMFI (Association of Mutual Funds in India)
AMFI is the industry body representing mutual funds in India. It publishes standardized mutual fund information, including scheme performance data submitted by Asset Management Companies (AMCs).
2. Asset Management Company (AMC)
An AMC is a company that manages mutual fund schemes by investing collected investor money according to the fund’s investment objective and strategy.
3. CAGR (Compound Annual Growth Rate)
CAGR represents the average annual return generated by an investment over a specific period, assuming the returns are compounded annually.
4. Benchmark Index
A benchmark index is a reference index used to evaluate a mutual fund’s performance. It helps investors understand whether a fund has generated returns above or below the market segment it represents.
5. NAV (Net Asset Value)
NAV is the per-unit value of a mutual fund scheme calculated based on the market value of its underlying investments after deducting expenses and liabilities.
6. Rolling Returns
Rolling returns measure a fund’s performance across multiple overlapping periods instead of a single fixed timeframe, helping investors evaluate consistency.
7. Sharpe Ratio
Sharpe Ratio measures the return generated by a mutual fund relative to the risk taken. A higher Sharpe Ratio generally indicates better risk-adjusted performance.
8. Sortino Ratio
Sortino Ratio evaluates returns against downside risk only, focusing on harmful volatility rather than all price fluctuations.
9. Expense Ratio
Expense Ratio is the annual fee charged by a mutual fund for managing the scheme. Lower expenses can improve investor returns over long investment periods.
10. Assets Under Management (AUM)
AUM represents the total market value of assets managed by a mutual fund scheme. It indicates the size of the fund but should not be considered a standalone measure of quality.
🔍 Transparency Note: How the Funds Mentioned in This Guide Were Selected
The mutual funds discussed in this article are included as examples to demonstrate the AMFI-based evaluation process.
They have been selected based on factors such as:
- Historical performance data available through AMFI.
- Long-term return consistency.
- Benchmark comparison.
- Investment approach.
- Fund management track record.
- Risk and portfolio characteristics.
However, mutual fund rankings change over time. A fund performing well today may not remain among the top performers in the future.
Investors should always review the latest available AMFI data, understand their own financial goals and risk tolerance, and complete their own analysis before making any investment decision.
The objective of this guide is not to identify a permanent “best mutual fund,” but to provide a structured method that investors can use to evaluate funds independently.
💭 Final Thoughts
Markets change, fund rankings change, and yesterday’s winners may not always remain tomorrow’s leaders.
However, a disciplined investment process remains valuable regardless of market conditions.
By combining official AMFI data with benchmark comparison, risk analysis, portfolio evaluation, and long-term thinking, investors can make more informed mutual fund decisions instead of simply following trends.
The best mutual fund selection process is not about predicting the future—it is about increasing the probability of making better decisions over the long term.
🚀 What to Read Next
➡️ Take Your Mutual Fund Screening Further with Value Research Online
⬅️ How to Choose Mutual Funds: Essential Selection Parameters for Smart Investors
🌱 New to Mutual Funds? Start Your Mutual Fund Investing Journey Now
📚 Explore Mutual Funds Articles & Guides
🏛️ Learn Investing, Build Wealth, and Achieve Financial Freedom
- Quick Answer
- Why Use Official AMFI Data?
- Step 1: Open the AMFI Mutual Fund Scheme Performance Page
- Step 2: Apply the Right Filters (Example: Mid Cap Funds)
- Step 3: Understand the AMFI Performance Table
- Step 4: How to Compare Mutual Funds Returns with the Benchmark (The Most Important Step)
- Step 5: Shortlist the Best Funds Using a 3-Stage Screening Framework
- Step 6: Apply the Framework – Evaluating Leading Mid Cap Mutual Funds
- Step 7: Looking Beyond Past Returns – Which Funds May Be Better Positioned for the Future?
- Step 8: Common Mistakes to Avoid When Selecting a Mutual Fund
- Step 9: Evaluate Mutual Funds Beyond Returns Using Advanced Metrics
- Conclusion: Use a Process, Not a Ranking, to Select Mutual Funds
- 📖 Next Read: Further Screen Your Mutual Fund Choices
- ❓ Frequently Asked Questions (FAQs) About How to Analyze Mutual Funds
- 📚 Glossary: How to Compare Mutual Funds
- 🔍 Transparency Note: How the Funds Mentioned in This Guide Were Selected
- 💭 Final Thoughts
- 🚀 What to Read Next
 Disclaimer
The information provided on this website is purely for educational and informational purposes only and should not be construed as financial, investment, tax, or legal advice. Investments in securities markets are subject to market risks. Please read all related documents carefully before investing. Past performance is not indicative of future results. Users are advised to consult their financial advisor before making any investment decisions.