How to Use Value Research Mutual Fund Screener to Compare Mutual Funds

In the previous article, we filtered thousands of mutual funds to identify a select group of high-quality Mid Cap funds using objective parameters such as fund category, performance relative to the benchmark, long-term returns, expense ratio, assets under management (AUM), and consistency of performance based on AMFI mutual fund data.
The next step, however, is to go beyond returns and evaluate these shortlisted funds through a risk-adjusted lens. After all, a strong-performing fund is not necessarily a better choice if those returns come with excessive volatility or downside risk.
This analysis focuses on identifying which funds have delivered better risk-adjusted outcomes while maintaining strong risk management, consistency, and resilience across market cycles.
Based on the initial screening, the final shortlist may include:
- Motilal Oswal Mid Cap Fund
- Invesco India Mid Cap Fund
- Nippon India Growth Fund
- Edelweiss Mid Cap Fund
- HDFC Mid Cap Opportunities Fund
- Mahindra Manulife Mid Cap Fund
- WhiteOak Capital Mid Cap Fund
At this stage, many investors make the mistake of selecting the fund with the highest historical return. However, higher returns don’t always mean a better mutual fund. Two funds may deliver similar returns, but one may have achieved them by taking significantly more risk than the other.
This is where the Value Research Mutual Fund Screener becomes an essential part of the selection process. It allows you to compare shortlisted funds using risk-adjusted performance metrics, helping you evaluate not just how much a fund earned, but also how efficiently it generated those returns.
Although we’ll continue using our Mid Cap fund shortlist throughout this guide, the same comparison process can be applied to other mutual fund categories, including Large Cap, Flexi Cap, Small Cap, ELSS, Hybrid, and Debt Funds.
In this guide, you’ll learn how to use the Value Research Mutual Fund Screener to compare mutual funds using key metrics such as the Sharpe Ratio, Sortino Ratio, Alpha, Beta, Standard Deviation, and Upside/Downside Capture Ratios. These metrics can help you assess a fund’s returns in the context of the risk it has taken and ultimately make a more informed investment decision.
- Why Use Value Research Mutual Fund Screener After AMFI Screening?
- Step 1: Open the Value Research Mutual Fund Screener
- Step 2: Set Up Your Fund Comparison
- Step 3: Compare the Snapshot
- Step 4: Compare Historical Returns
- Step 5: Compare the Portfolio
- Step 6: Compare Risk-Adjusted Performance
- Step 7: Final Comparison and Shortlisting the Best Mid Cap Funds
- The Complete Mutual Fund Selection Framework
- Final Thoughts
- 📖 Next Read: Mutual Fund Selection Checklist: Put Everything Together
- ❓ Frequently Asked Questions (FAQs) About Value Research Mutual Fund Screener
- 📚 Glossary: Key Mutual Fund Terms You Should Know to Compare Mutual Funds
- 🚀 What to Read Next
Why Use Value Research Mutual Fund Screener After AMFI Screening?
In the previous article, we used the AMFI mutual fund screener to narrow our choices based on objective factors. That process helped us identify a shortlist of quality Mid Cap funds. However, the next challenge is deciding which of those funds is the better investment.
This is where Value Research complements the AMFI screener. Instead of focusing only on returns, it provides risk-adjusted performance metrics that help you evaluate how efficiently a fund generated its returns.
Think of the process as a two-step filter:
- AMFI helps you identify fundamentally strong funds.
- Value Research helps you compare those shortlisted funds based on the level of risk taken to generate their returns.
Using both tools together results in a more disciplined and informed mutual fund selection process.
Step 1: Open the Value Research Mutual Fund Screener
Open the Value Research Mutual Fund Screener ↗. This tool allows you to filter, compare, and analyze mutual funds using a wide range of performance, portfolio, and risk-related parameters.
Since we’ve already shortlisted our Mid Cap funds, we won’t use the screener to discover new funds. Instead, we’ll use it to compare the shortlisted funds using advanced risk-adjusted performance metrics.
When the screener opens, you’ll notice two main sections:
- Filters at the top to narrow down funds based on criteria such as Fund House, Category, Plan Type, and Value Research Rating.
- Results table below, which displays mutual funds along with various tabs such as Snapshot, Returns, Portfolio, Risk, NAV Details, and Fees & Details.
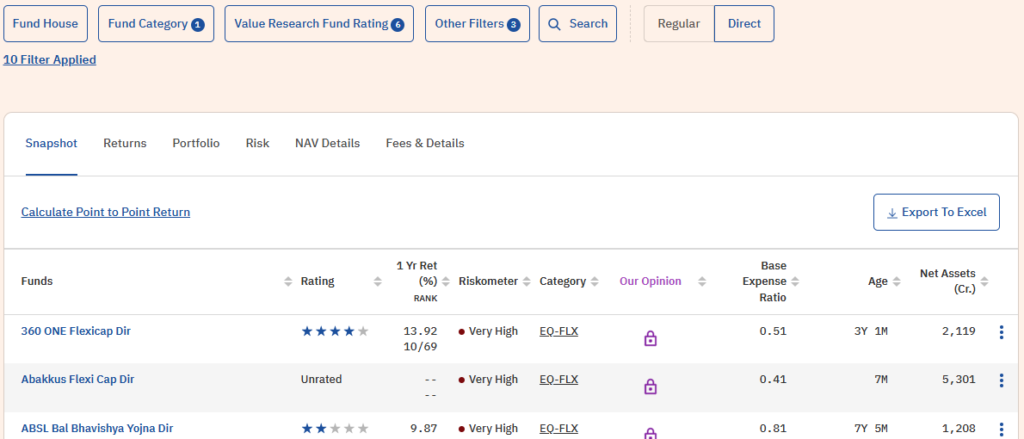
Although we’ll continue with our shortlisted Mid Cap funds, you can use the same process to compare funds from any category by applying the appropriate filters.
Step 2: Set Up Your Fund Comparison
Before comparing mutual funds, ensure you’re comparing similar funds under the same conditions. This helps you make a fair, like-for-like comparison and avoids drawing misleading conclusions.
Since our shortlist consists of Mid Cap funds, we’ll select the Mid Cap Fund category in the Value Research Mutual Fund Screener. If you’re evaluating another category, such as Large Cap, Flexi Cap, ELSS, or Hybrid Funds, choose the corresponding category instead.
Next, select Direct Plans. Direct plans have lower expense ratios because they don’t include distributor commissions. Over the long term, the lower cost can have a meaningful impact on your investment returns.
At this stage, you can also use the Search option to quickly locate the shortlisted funds.
If you prefer, you can apply the Mid Cap category filter and compare all available funds in that category. However, comparing a smaller, carefully shortlisted group makes the analysis simpler and more focused.
✅ Best Practice
Always compare funds within the same category and plan type. For example, compare Mid Cap Direct Plans with other Mid Cap Direct Plans. Avoid comparing different categories or mixing Direct and Regular plans, as their investment objectives, costs, and risk profiles differ.
Step 3: Compare the Snapshot
The Snapshot section provides a quick overview of each mutual fund. Think of it as your first quality check before diving into detailed performance and risk analysis.
| Funds | Rating | 1 Yr Ret (%) | Riskometer | Expense Ratio | Age | Net Assets (Cr.) |
| Edelweiss Mid Cap Dir |  | 12.24 | Very High | 0.41 | 13Y 7M | 17,748 |
| HDFC Mid Cap Dir | | 12.83 | Very High | 0.61 | 13Y 7M | 1,00,858 |
| Invesco India Mid cap Dir |  | 13.89 | Very High | 0.48 | 13Y 7M | 14,744 |
| Mahindra Manulife Mid Cap Dir | | 17.02 | Very High | 0.49 | 8Y 6M | 5,076 |
| Motilal Oswal Midcap Dir |  | 1.69 | Very High | 0.65 | 12Y 5M | 37,474 |
| Nippon India Growth Mid Cap Dir | | 13.14 | Very High | 0.58 | 13Y 7M | 49,169 |
| WhiteOak Capital Mid Cap Fund Dir | | 18.77 | Very High | 0.44 | 3Y 11M | 6,933 |
For each fund in your shortlist, compare the following key parameters:
1. Expense Ratio
The Expense Ratio is the annual fee charged by the fund house for managing the scheme. Since we’re comparing Direct Plans, the expense ratios will generally be lower than their Regular Plan counterparts.
When two funds have similar long-term performance, the one with the lower expense ratio may provide slightly better returns over time because less of your investment goes toward management fees.
2. Assets Under Management (AUM)
AUM (Assets Under Management) represents the total value of money invested in the fund.
A larger AUM often reflects investor confidence and provides better operational stability. However, an extremely large AUM can sometimes make it more challenging for a Mid Cap fund to deploy capital efficiently, while a very small AUM may indicate limited investor interest or a relatively new scheme.
Rather than choosing the fund with the highest AUM, look for one with a healthy and sustainable asset base.
3. Fund Age
A fund with a longer track record has experienced different market cycles, including bull markets, bear markets, corrections, and recoveries.
This provides more historical data to evaluate how consistently the fund has performed over time.
While newer funds shouldn’t be dismissed solely because of their age, funds with a longer and consistent performance history generally provide greater confidence during the comparison process.
4. Fund Manager
Review the Fund Manager responsible for the scheme and note how long they have been managing the fund.
A long-tenured fund manager with a consistent investment approach can be a positive indicator. However, remember that mutual fund performance depends on the investment process, research team, and portfolio strategy—not just one individual.
5. Benchmark Index
Check the benchmark used by each fund, such as the NIFTY Midcap 150 TRI or BSE MidCap TRI.
The benchmark serves as the standard against which the fund’s performance is measured. When comparing returns and risk metrics in the following steps, always evaluate a fund relative to its own benchmark.
| Benchmark | 1 Yr Ret (%) | 3 Yr Ret (%) | 5 Yr Ret (%) | 10 Yr Ret (%) |
| Nifty Midcap 150 TRI | 11.19 | 18.95 | 17.96 | 17.79 |
| BSE Midcap 150 TRI | 10.70 | 18.48 | 17.04 | 17.36 |
Snapshot Checklist
Before moving to the next step, ask yourself:
- Are all the funds from the same category and Direct Plan?
- Do they have a reasonable operating history?
- Are the expense ratios broadly competitive?
- Do they have a healthy AUM?
- Is there any obvious reason to eliminate a fund at this stage?
If the answer is No, you can confidently move on to comparing their historical returns.
💡 Note
While Value Research Star Ratings can be useful for an initial screen, they shouldn’t be the deciding factor. Since we’ve already shortlisted quality Mid Cap funds, we’ll focus on objective measures such as returns, portfolio characteristics, and risk-adjusted performance.
How to Interpret the Snapshot Comparison
At this stage, we are not trying to identify the “best” Mid Cap fund. The purpose of the Snapshot comparison is to remove funds that may have obvious disadvantages.
Look for:
- Reasonable expense ratio: Lower costs are beneficial when comparing funds with similar performance.
- Adequate fund history: A longer track record helps evaluate performance across multiple market cycles.
- Healthy AUM: A very small fund size may raise questions about sustainability, while an extremely large fund size may create challenges in managing a Mid Cap portfolio.
- Stable fund management: A consistent investment team and clearly defined strategy provide better confidence.
- Appropriate benchmark: Ensure performance comparisons are made against the correct benchmark.
After this first review, move to the next stage—Returns Analysis—where we evaluate whether these funds have delivered consistent performance over different time periods.
Step 4: Compare Historical Returns
After completing the Snapshot analysis, the next step is to evaluate the historical performance of your shortlisted mutual funds.
Returns are important because they show how much wealth a fund has created over different periods. However, returns should not be viewed in isolation. A fund that delivered the highest return in one period may have taken significantly higher risks to achieve it.
The objective at this stage is not to select the fund with the maximum return. Instead, identify funds that have delivered consistent long-term performance across different market cycles.
For our Mid Cap fund comparison, we will evaluate:
- Short-term returns
- Medium-term returns
- Long-term returns
- Consistency across periods
- Performance relative to the benchmark
Which Return Periods Should You Compare?
1. 1-Year Returns
One-year returns show recent performance but should not be given too much importance.
A Mid Cap fund may outperform or underperform significantly in a single year due to market conditions, sector cycles, or temporary portfolio positioning.
Use 1-year returns mainly to understand recent momentum—not to make a final decision.
The table below lists all mutual funds that have delivered higher returns than their respective benchmarks over the past one year.
| Funds | 1 Yr Ret (%) |
| HSBC Midcap Dir | 22.02 |
| WhiteOak Capital Mid Cap Fund Dir | 18.77 |
| Helios Mid Cap Dir | 18.67 |
| ICICI Pru Midcap Dir | 17.70 |
| Mahindra Manulife Mid Cap Dir | 17.02 |
| Baroda BNP Paribas Midcap Dir | 15.92 |
| Mirae Asset Midcap Dir | 15.60 |
| ITI Mid Cap Dir | 15.56 |
| Union Midcap Dir | 14.41 |
| Invesco India Mid cap Dir | 13.89 |
| Nippon India Growth Mid Cap Dir | 13.14 |
| JM Midcap Dir | 13.11 |
| HDFC Mid Cap Dir | 12.83 |
| Sundaram Midcap Dir | 12.58 |
| Bandhan Midcap Dir | 12.52 |
| Edelweiss Mid Cap Dir | 12.24 |
| ABSL Mid Cap Dir | 11.61 |
| Tata Mid Cap Dir | 11.58 |
| Kotak Midcap Dir | 10.72 |
2. 3-Year Returns
The 3-year period provides a better picture because it includes a longer market phase.
It helps evaluate whether recent performance was supported by a sustainable investment approach rather than a short-term advantage.
The table below lists all mutual funds that have outperformed their respective benchmarks over the past three years.
| Funds | 3 Yr Ret (%) |
| Invesco India Mid cap Dir | 26.14 |
| HSBC Midcap Dir | 26.05 |
| WhiteOak Capital Mid Cap Fund Dir | 23.98 |
| ICICI Pru Midcap Dir | 23.89 |
| Edelweiss Mid Cap Dir | 23.69 |
| ITI Mid Cap Dir | 23.30 |
| Mahindra Manulife Mid Cap Dir | 22.77 |
| Nippon India Growth Mid Cap Dir | 21.89 |
| Sundaram Midcap Dir | 21.83 |
| JM Midcap Dir | 21.711 |
| Motilal Oswal Midcap Dir | 20.58 |
| HDFC Mid Cap Dir | 20.54 |
| Bandhan Midcap Dir | 20.46 |
| Kotak Midcap Dir | 20.40 |
| Baroda BNP Paribas Midcap Dir | 19.91 |
| Canara Robeco Mid Cap Dir | 19.57 |
| Union Midcap Dir | 19.12 |
| Mirae Asset Midcap Dir | 18.72 |
| Franklin India Mid Cap Dir | 18.63 |
| LIC MF Midcap Dir | 18.60 |
3. 5-Year Returns
The 5-year CAGR is one of the most useful measures for comparing equity mutual funds.
A five-year period usually covers different market conditions and gives a better indication of a fund’s ability to compound wealth over time.
The table below lists all mutual funds that have outperformed their respective benchmarks over the past five years.
| Funds | 5 Yr Ret (%) |
| Motilal Oswal Midcap Dir | 23.20 |
| Invesco India Mid cap Dir | 21.03 |
| HDFC Mid Cap Dir | 20.61 |
| Nippon India Growth Mid Cap Dir | 19.96 |
| Edelweiss Mid Cap Dir | 19.81 |
| HSBC Midcap Dir | 19.57 |
| Mahindra Manulife Mid Cap Dir | 19.43 |
| Sundaram Midcap Dir | 19.07 |
| ICICI Pru Midcap Dir | 18.44 |
| Kotak Midcap Dir | 18.06 |
| ITI Mid Cap Dir | 17.48 |
| Quant Mid Cap Dir | 17.17 |
4. 7-Year and 10-Year Returns
For funds with a longer history, extended periods provide valuable insights into consistency.
A fund that has performed well over multiple market cycles demonstrates greater evidence of a repeatable investment process.
The table below lists all mutual funds that have outperformed their respective benchmarks over the past ten years.
| Funds | 10 Yr Ret (%) |
| Invesco India Mid cap Dir | 20.04 |
| Edelweiss Mid Cap Dir | 19.53 |
| Nippon India Growth Mid Cap Dir | 18.87 |
| Kotak Midcap Dir | 18.48 |
| Quant Mid Cap Dir | 18.46 |
| HDFC Mid Cap Dir | 18.18 |
| HSBC Midcap Dir | 18.04 |
| Axis Midcap Dir | 18.00 |
| Motilal Oswal Midcap Dir | 17.77 |
| ICICI Pru Midcap Dir | 17.51 |
Compare Returns Using a Table
For our shortlisted Mid Cap funds, create a comparison table like this:
| Funds | 3 Yr Ret (%) | 5 Yr Ret (%) | 10 Yr Ret (%) |
| Edelweiss Mid Cap Dir | 23.69 | 19.81 | 19.53 |
| HDFC Mid Cap Dir | 20.54 | 20.61 | 18.18 |
| Invesco India Mid cap Dir | 26.14 | 21.03 | 20.04 |
| Mahindra Manulife Mid Cap Dir | 22.77 | 19.43 | —- |
| Motilal Oswal Midcap Dir | 20.58 | 23.20 | 17.77 |
| Nippon India Growth Mid Cap Dir | 21.89 | 19.96 | 18.87 |
| WhiteOak Capital Mid Cap Fund Dir | 23.98 | —- | —- |
Look for Consistency, Not Just the Highest Number
When comparing the table, avoid choosing a fund simply because it ranks first in one return category.
For example:
- HSBC Midcap Direct has delivered the highest 1-year return, but its position is less prominent when viewed over the longer term.
- Invesco India Mid Cap Direct, despite lower recent returns, has shown stronger and more consistent performance over the 5- and 10-year periods.
A stronger candidate is usually a fund that performs consistently across multiple periods rather than one that appears at the top only during a specific market phase.
Check Performance Against the Benchmark
Returns should always be evaluated relative to the fund’s benchmark.
A fund generating 15% annual returns may appear attractive, but if its benchmark delivered 16% during the same period, the fund has not added value after considering its active management.
Look for funds that have demonstrated the ability to outperform their benchmark over longer periods while maintaining reasonable risk.
Rolling Returns: A Better Measure of Consistency
If available, review rolling returns rather than relying only on point-to-point returns.
Point-to-point returns depend heavily on the start and end dates. For example, a fund may appear excellent if measured from a market low but less impressive if measured from a market peak.
Rolling returns evaluate performance across multiple overlapping periods, providing a more realistic picture of consistency.
Decision After Returns Analysis
At the end of this stage, do not select the winner yet.
Instead, shortlist funds that show:
✅ Strong 5-year and long-term performance
✅ Consistent performance across different periods
✅ Reasonable benchmark outperformance
✅ No dependence on a single exceptional year
These funds will move to the next stage: Portfolio Analysis, where we examine how these returns were generated. Portfolio Analysis will be very interesting because Mid Cap funds often look similar on returns but differ significantly in sector allocation, concentration, and investment style.
Step 5: Compare the Portfolio
After analyzing historical returns, the next step is to understand what is inside the fund’s portfolio.
Returns only tell you the outcome. Portfolio analysis helps you understand the investment decisions that produced those returns.
For our shortlisted Mid Cap funds, we will compare:
- Number of holdings
- Top holdings concentration
- Sector allocation
- Market capitalization exposure
- Portfolio turnover
- Cash allocation
- Investment style
This helps answer an important question:
“Is the fund’s current portfolio aligned with the strategy and risk level I am comfortable with?”
The table below compares the portfolio characteristics of the selected mutual funds.
| Funds | Minimum Investment | Base Expense Ratio | Exit Load (Period) | Fund Manager (Tenure) |
| Edelweiss Mid Cap Dir | 100 | 0.41 | 1.00 (90) | Trideep Bhattacharya (4.9), Dhruv Bhatia (1.8), Mehul Dalmia (0) |
| HDFC Mid Cap Dir | 100 | 0.61 | 1.00 (365) | Chirag Setalvad (13.6) |
| Invesco India Mid cap Dir | 100 | 0.48 | 1.00 (365) | Aditya Khemani (2.7) |
| Mahindra Manulife Mid Cap Dir | 1,000 | 0.49 | 1.00 (90) | Krishna Sanghavi (1.8), Neelesh Dhamnaskar (0.5), Kirti Dalvi (1.7) |
| Motilal Oswal Midcap Dir | 500 | 0.65 | 1.00 (365) | Rakesh Shetty (3.7), Ajay Khandelwal (1.9), Varun Sharma (0.5), Ankit Agarwal (0.5) |
| Nippon India Growth Mid Cap Dir | 100 | 0.58 | 1.00 (30) | Rupesh Patel (3.6) |
| WhiteOak Capital Mid Cap Fund Dir | 500 | 0.44 | — | Piyush Baranwal (4), Ramesh Mantri (4), Dheeresh Pathak (2.4), Ashish Agrawal (1.6), Trupti Agrawal (3.9) |
1. Number of Holdings
The number of stocks held by a mutual fund gives an indication of portfolio diversification.
A fund with too few holdings may have higher concentration risk because the performance depends heavily on a limited number of companies.
A fund with too many holdings may become overly diversified, reducing the impact of high-conviction ideas.
There is no universally ideal number of holdings. The objective is to understand whether the portfolio structure matches the fund manager’s investment approach.
2. Top 10 Holdings Concentration
Review the percentage of the portfolio invested in the top 10 companies.
For example:
| Fund | Number of Holdings | Top 10 Holdings (%) |
|---|---|---|
| Motilal Oswal Mid Cap Fund | — | — |
| Invesco India Mid Cap Fund | — | — |
| Nippon India Growth Fund | — | — |
| Edelweiss Mid Cap Fund | — | — |
| HDFC Mid Cap Opportunities Fund | — | — |
| Mahindra Manulife Mid Cap Fund / WhiteOak Capital Mid Cap Fund | — | — |
A higher concentration is not automatically negative. A fund manager with strong conviction may intentionally hold fewer stocks.
However, higher concentration can increase volatility if some major holdings underperform.
3. Sector Allocation
Compare how each fund is distributed across different sectors.
Example:
| Sector | Fund A | Fund B | Fund C |
|---|---|---|---|
| Financial Services | — | — | — |
| Industrial/Manufacturing | — | — | — |
| Healthcare | — | — | — |
| Technology | — | — | — |
| Consumer | — | — | — |
Sector allocation helps identify whether a fund is:
- Diversified across multiple themes
- Concentrated in specific sectors
- Dependent on a particular market cycle
For example, a fund with a large exposure to one sector may perform very well when that sector is in favour but may face challenges when the cycle reverses.
4. Market Capitalization Exposure
Although these funds belong to the Mid Cap category, their actual portfolio allocation may differ.
Compare exposure to:
- Mid Cap companies
- Large Cap companies
- Small Cap companies
Some Mid Cap funds may hold a portion of large companies for stability, while others may take higher exposure to smaller companies for growth potential.
A higher small-cap allocation may increase return potential but can also increase volatility.
5. Portfolio Turnover Ratio
The Portfolio Turnover Ratio indicates how frequently the fund buys and sells securities.
A higher turnover may indicate:
- Active portfolio management
- Frequent changes based on market opportunities
A lower turnover may indicate:
- Long-term investment approach
- Greater patience with portfolio holdings
Neither approach is automatically superior. The important question is whether the investment style has translated into consistent results.
6. Cash Allocation
Check how much of the portfolio is held in cash or cash-equivalent instruments.
A higher cash allocation may indicate:
- Defensive positioning
- Availability of funds for future opportunities
However, excessive cash holdings during strong equity markets may reduce participation in market gains.
Portfolio Comparison Table
For our shortlisted Mid Cap funds, create a comparison table like this:
| Funds | Market Cap | Turnover | Net Assets (Cr.) |
| Edelweiss Mid Cap Dir | 70,466 | 38.00 | 17,748 |
| HDFC Mid Cap Dir | 57,672 | 4.42 | 1,00,858 |
| Invesco India Mid cap Dir | 66,868 | 28.00 | 14,744 |
| Mahindra Manulife Mid Cap Dir | 58,639 | 50.00 | 5,076 |
| Motilal Oswal Midcap Dir | 86,237 | 84.00 | 37,474 |
| Nippon India Growth Mid Cap Dir | 75,364 | 10.00 | 49,169 |
| WhiteOak Capital Mid Cap Fund Dir | 52,787 | 235.00 | 6,933 |
An extended comparison of the selected funds is presented in the table below:
| Fund | No. of Stocks | Top 10 Holdings % | Largest Sector Exposure | Mid Cap Allocation | Small Cap Allocation | Portfolio Turnover |
|---|---|---|---|---|---|---|
| Motilal Oswal Mid Cap Fund | — | — | — | — | — | — |
| Invesco India Mid Cap Fund | — | — | — | — | — | — |
| Nippon India Growth Fund | — | — | — | — | — | — |
| Edelweiss Mid Cap Fund | — | — | — | — | — | — |
| HDFC Mid Cap Opportunities Fund | — | — | — | — | — | — |
| Mahindra Manulife Mid Cap Fund / WhiteOak Capital Mid Cap Fund | — | — | — | — | — | — |
How to Interpret the Portfolio Comparison
At this stage, avoid selecting a fund only because it has the highest return.
Instead, look for:
✅ A portfolio that matches your risk tolerance
✅ Reasonable diversification
✅ No excessive dependence on a few stocks or sectors
✅ A consistent investment approach
✅ Alignment between portfolio strategy and past performance
A fund’s portfolio should give you confidence that its past performance was generated through a repeatable investment process rather than temporary factors.
After understanding what the fund owns, the next step is the most important part of the analysis: evaluating how efficiently the fund generated those returns through risk-adjusted metrics.
Next, we will compare the Risk Analysis section using Sharpe Ratio, Sortino Ratio, Alpha, Beta, Standard Deviation, and Capture Ratios.
Step 6: Compare Risk-Adjusted Performance
After analyzing returns and portfolio characteristics, the next step is to evaluate how efficiently each fund generated those returns.
A mutual fund delivering higher returns is not necessarily the better investment if it achieved those returns by taking significantly higher risk.
For example:
- Fund A delivered 18% annual returns with high volatility.
- Fund B delivered 16% annual returns with much lower volatility.
Depending on the investor’s risk preference, Fund B may represent a more efficient investment.
The Value Research Risk section provides several important metrics to compare this efficiency:
- Sharpe Ratio
- Sortino Ratio
- Alpha
- Beta
- Standard Deviation
- Upside Capture Ratio
- Downside Capture Ratio
For our shortlisted Mid Cap funds, we will use these metrics to identify funds that have historically delivered better risk-adjusted performance.
| Funds | Risk | Fund Return Grade | Riskometer | Standard Deviation | Sharpe Ratio | Sortino Ratio | Beta | Alpha | R-Squared |
| Edelweiss Mid Cap Dir | Below Average | Above Average | Very High | 17.68 | 0.95 | 1.20 | 0.96 | 4.83 | 0.95 |
| HDFC Mid Cap Dir | Low | Above Average | Very High | 15.35 | 0.87 | 1.04 | 0.84 | 2.98 | 0.95 |
| Invesco India Mid cap Dir | Average | High | Very High | 19.55 | 0.98 | 1.21 | 1.03 | 6.29 | 0.89 |
| Mahindra Manulife Mid Cap Dir | Average | Above Average | Very High | 17.30 | 0.88 | 1.19 | 0.95 | 3.37 | 0.97 |
| Motilal Oswal Midcap Dir | High | Above Average | Very High | 20.48 | 0.73 | 0.97 | 0.98 | 2.79 | 0.73 |
| Nippon India Growth Mid Cap Dir | Below Average | High | Very High | 17.82 | 0.86 | 1.14 | 0.97 | 3.24 | 0.95 |
| WhiteOak Capital Mid Cap Fund Dir | Low | High | Very High | 16.89 | 1.00 | 1.30 | 0.91 | 5.55 | 0.93 |
1. Sharpe Ratio: Return Generated for Total Risk Taken
The Sharpe Ratio measures how much additional return a fund generated for every unit of total risk taken.
In simple terms:
Higher Sharpe Ratio = Better risk-adjusted return
Example:
| Fund | 5-Year Return | Sharpe Ratio |
|---|---|---|
| Fund A | 17% | 1.10 |
| Fund B | 17% | 0.85 |
Both funds generated the same return, but Fund A achieved it more efficiently because it delivered a higher return per unit of risk.
When comparing Mid Cap funds, prefer funds that have maintained a consistently higher Sharpe Ratio over longer periods.
2. Sortino Ratio: Measuring Downside Risk
The Sortino Ratio is similar to the Sharpe Ratio but focuses only on downside volatility.
Investors generally worry more about losses than normal price fluctuations. The Sortino Ratio therefore provides insight into how well a fund managed harmful downside movements.
Generally:
- Higher Sortino Ratio = Better downside risk-adjusted performance
- Lower Sortino Ratio = More downside risk for the return generated
Example:
| Fund | Sortino Ratio |
|---|---|
| Fund A | 1.45 |
| Fund B | 1.10 |
Fund A has historically provided better compensation for downside risk.
3. Alpha: Value Added by Fund Management
Alpha measures the excess return generated by a fund compared with what would be expected based on its market risk.
A positive Alpha indicates that the fund has historically outperformed its benchmark after adjusting for risk.
Example:
- Alpha = +3% → Fund generated approximately 3% additional return over the expected return based on its risk level.
- Negative Alpha → Fund underperformed relative to expectations.
When comparing similar Mid Cap funds, a consistently positive Alpha can indicate effective fund management.
However, Alpha should not be viewed alone. A fund may generate high Alpha by taking concentrated positions, which must be evaluated through portfolio and volatility measures.
4. Beta: Sensitivity to Market Movements
Beta measures how much a fund moves compared with its benchmark.
Interpretation:
| Beta | Meaning |
|---|---|
| 1 | Moves approximately in line with the market |
| Above 1 | More sensitive than the market |
| Below 1 | Less sensitive than the market |
Example: A fund with Beta of 1.15 may rise more during strong markets but may also fall more during market corrections.
A lower Beta does not automatically mean a better fund. It simply indicates a different risk profile.
Compare Beta only among funds in the same category.
5. Standard Deviation: Measuring Volatility
Standard Deviation shows how much a fund’s returns fluctuate around its average return.
Lower standard deviation generally indicates a smoother investment journey.
Example:
| Fund | 5-Year Return | Standard Deviation |
|---|---|---|
| Fund A | 16% | 14 |
| Fund B | 16% | 19 |
Both funds delivered similar returns, but Fund A experienced lower fluctuations.
For investors who prefer a smoother ride, lower volatility can be an important consideration.
6. Capture Ratios: Performance During Market Cycles
Capture ratios help understand how a fund behaves during different market conditions.
Upside Capture Ratio
Measures how much of the benchmark’s gains the fund captures during rising markets.
Example: Upside Capture Ratio of 110 means the fund captured 110% of benchmark gains.
Higher upside capture indicates stronger participation during market rallies.
Downside Capture Ratio
Measures how much of the benchmark’s decline the fund experiences during falling markets.
Example: Downside Capture Ratio of 80 means the fund fell 80% as much as the benchmark during market declines.
Lower downside capture is generally preferred because it indicates better protection during market falls.
Risk Comparison Table
For our shortlisted Mid Cap funds, compare:
| Fund | Sharpe Ratio | Sortino Ratio | Alpha | Beta | Standard Deviation | Upside Capture | Downside Capture |
|---|---|---|---|---|---|---|---|
| Motilal Oswal Mid Cap Fund | — | — | — | — | — | — | — |
| Invesco India Mid Cap Fund | — | — | — | — | — | — | — |
| Nippon India Growth Fund | — | — | — | — | — | — | — |
| Edelweiss Mid Cap Fund | — | — | — | — | — | — | — |
| HDFC Mid Cap Opportunities Fund | — | — | — | — | — | — | — |
| Mahindra Manulife Mid Cap Fund / WhiteOak Capital Mid Cap Fund | — | — | — | — | — | — | — |
Data as of: Month Year
How to Interpret the Risk Comparison
No single metric can identify the best mutual fund.
A strong candidate usually demonstrates a combination of:
✅ Competitive returns
✅ Higher Sharpe and Sortino Ratios
✅ Positive Alpha
✅ Reasonable Beta
✅ Controlled volatility
✅ Better downside protection
For example:
- A fund with the highest return but poor downside protection may not be the most efficient choice.
- A fund with slightly lower returns but significantly better risk-adjusted metrics may offer a more balanced investment experience.
The objective is not to find the fund with the highest return. The objective is to identify the fund that has historically delivered the best combination of return, consistency, and risk management.
After completing this step, we can combine the findings from Snapshot, Returns, Portfolio, and Risk Analysis to create the final shortlist.
Step 7: Final Comparison and Shortlisting the Best Mid Cap Funds
After completing the Snapshot, Returns, Portfolio, and Risk Analysis, you now have a complete view of each shortlisted Mid Cap fund.
At this stage, avoid selecting a fund based on a single factor such as the highest return or highest Value Research rating.
A good mutual fund selection decision considers multiple factors together:
- Performance consistency
- Risk-adjusted returns
- Portfolio quality
- Cost efficiency
- Investment strategy
- Downside protection
The objective is to identify funds that have demonstrated a balanced combination of return generation and risk management.
Create a Final Comparison Scorecard
To make the decision-making process easier, summarize your observations in one table.
| Fund | Snapshot | Returns | Portfolio | Risk Metrics | Overall Observation |
|---|---|---|---|---|---|
| Motilal Oswal Mid Cap Fund | — | — | — | — | — |
| Invesco India Mid Cap Fund | — | — | — | — | — |
| Nippon India Growth Fund | — | — | — | — | — |
| Edelweiss Mid Cap Fund | — | — | — | — | — |
| HDFC Mid Cap Opportunities Fund | — | — | — | — | — |
| Mahindra Manulife Mid Cap Fund / WhiteOak Capital Mid Cap Fund | — | — | — | — | — |
This table should not be treated as a mechanical ranking system. Instead, it provides a structured way to compare the strengths and weaknesses of each fund.
What Makes a Strong Candidate?
After completing the analysis, a strong Mid Cap fund generally demonstrates:
1. Consistent Long-Term Performance
Look for funds that have performed well across multiple periods rather than funds that are temporarily leading because of a recent market trend.
2. Efficient Risk Management
Prefer funds that have generated competitive returns with:
- Better Sharpe Ratio
- Better Sortino Ratio
- Controlled volatility
- Reasonable downside capture
3. Sustainable Portfolio Strategy
A good portfolio should show:
- Appropriate diversification
- No excessive dependence on a few stocks
- A clear investment philosophy
- Consistency between portfolio strategy and historical performance
4. Reasonable Costs
Expense ratio matters, especially over long investment periods.
When two funds have similar performance and risk characteristics, a lower-cost option may have an advantage.
Example of Final Decision Framework
Instead of asking: “Which Mid Cap fund gave the highest return?”
Ask:
| Question | What to Evaluate |
|---|---|
| Which funds created wealth consistently? | Long-term returns |
| Which funds handled volatility better? | Sharpe Ratio, Sortino Ratio, Standard Deviation |
| Which funds protected better during market declines? | Downside Capture Ratio |
| Which funds have a sustainable investment approach? | Portfolio analysis |
| Which funds are cost-efficient? | Expense ratio |
This approach helps you identify funds that have historically provided a better overall investment experience.
Narrow Down to the Final 2–3 Funds
After completing the comparison, reduce the shortlist to the final 2–3 funds that best match your investment objective and risk tolerance.
For example:
- Conservative investors may prefer funds with smoother performance and better downside protection.
- Investors with higher risk tolerance may accept higher volatility for stronger growth potential.
The final selection should depend on your investment horizon, financial goals, and ability to tolerate market fluctuations.
Important Reminder: Mutual Fund Selection Is Not Permanent
A fund that performs well today may not remain a top performer forever.
After investing, continue monitoring:
- Change in fund management
- Major changes in investment strategy
- Significant portfolio shifts
- Long-term performance deterioration
- Expense ratio changes
The goal is not to frequently switch funds based on short-term performance, but to review whether the original investment thesis remains valid.
The Complete Mutual Fund Selection Framework
This two-part approach creates a disciplined investment framework, and the complete process now looks like this:
Step 1: Build the Shortlist Using AMFI Data
Fund Universe (Thousands of funds)
↓
Category Selection
↓
Benchmark & Performance Analysis
↓
Expense Ratio, AUM, and Consistency Review
↓
Shortlisted Funds
Step 2: Compare Shortlisted Funds Using Value Research
Snapshot Analysis
↓
Returns Analysis
↓
Portfolio Analysis
↓
Risk-Adjusted Performance Analysis
↓
Final Shortlist
This two-stage framework provides a structured approach to evaluating mutual funds by combining performance analysis with risk assessment, helping investors make more informed long-term investment decisions.
By considering both returns and risk, investors can move beyond simply chasing recent winners and instead evaluate funds based on a broader view of performance, consistency, and resilience across market cycles.
Our Analysis Approach Disclaimer
This comparison framework is designed to evaluate mutual funds based on historical data and publicly available information. Past performance does not guarantee future returns. Investors should consider their financial goals, investment horizon, and risk profile before making investment decisions.
Final Thoughts
Selecting a mutual fund should not be based only on the fund with the highest historical return.
A disciplined selection process involves multiple layers of analysis:
- AMFI Screening helps you build an initial shortlist by evaluating factors such as fund category, benchmark performance, long-term returns, expense ratio, AUM, and consistency.
- Value Research Analysis helps you compare those shortlisted funds in greater detail by evaluating Snapshot details, Historical returns, Portfolio characteristics, and Risk-adjusted performance metrics.
The most important lesson is that returns should always be viewed together with risk.
A fund that delivered excellent returns with excessive volatility may not always be the best choice. A fund that generated competitive returns with better downside protection, lower volatility, and consistent performance may provide a more balanced investment experience.
For our Mid Cap fund analysis, we used a shortlist of funds and evaluated them across four important dimensions:
- Returns: Did the fund create wealth consistently?
- Portfolio: How did the fund generate those returns?
- Risk: Were the returns efficient compared with the risk taken?
- Cost: Are expenses reasonable for the value provided?
This approach helps investors move away from chasing recent winners and instead focus on funds that have demonstrated a more consistent and efficient investment process.
Remember, mutual fund selection is only the first step. Once invested, continue reviewing whether the fund’s strategy, performance, and risk profile remain aligned with your financial goals.
A structured process, patience, and regular review are more important than trying to identify the “perfect” fund.
📖 Next Read: Mutual Fund Selection Checklist: Put Everything Together
You’ve completed the core process of selecting your mutual funds. Now, let’s bring everything together in one simple place—so you can select, compare, and review your funds without going back through multiple articles or notes.
In the next article, we’ll turn the entire selection process into a practical checklist that you can download as an Excel/PDF, use on your mobile or computer, or even print and complete with pen and paper.
There are still more detailed documents to explore—such as the factsheet, SID, and other scheme documents—but for a beginner, this checklist is a good place to pause and close the selection process.
No hurry. No need to select everything at once. We’ll continue step by step.
👉 Next: Mutual Fund Selection Checklist: Put Everything Together – Download & Use (Excel/PDF)
❓ Frequently Asked Questions (FAQs) About Value Research Mutual Fund Screener
1. What is the Value Research Mutual Fund Screener?
The Value Research Mutual Fund Screener is a tool that helps investors analyze and compare mutual funds using different parameters such as returns, risk metrics, portfolio details, expense ratio, fund ratings, and other important data points.
Unlike a simple return comparison, the screener allows investors to evaluate how efficiently a mutual fund generated returns by considering the risk taken. It can be used to compare funds across categories such as Mid Cap, Large Cap, Flexi Cap, Small Cap, ELSS, Hybrid, and Debt Funds.
2. How do I compare mutual funds using the Value Research Mutual Fund Screener?
To compare mutual funds using the Value Research Mutual Fund Screener, first select funds belonging to the same category and plan type.
A structured comparison process usually involves:
– Reviewing fund details such as expense ratio, AUM, and fund age
– Comparing historical returns across different periods
– Analyzing portfolio characteristics such as holdings and sector allocation
– Evaluating risk-adjusted metrics like Sharpe Ratio, Sortino Ratio, Alpha, Beta, and Standard Deviation
The objective is not to find the fund with the highest return but to identify funds that have generated consistent returns with efficient risk management.
3. Should I select a mutual fund only based on historical returns?
No. Historical returns are important, but they should not be the only factor when selecting a mutual fund.
A fund with the highest past return may have achieved that performance by taking higher risks. Two funds can deliver similar returns while having very different levels of volatility and downside protection.
A better approach is to evaluate returns along with:
– Risk-adjusted performance
– Portfolio quality
– Expense ratio
– Consistency across market cycles
– Investment strategy
4. Is a higher Sharpe Ratio always better?
Generally, a higher Sharpe Ratio indicates that a mutual fund has generated better returns for the amount of risk taken.
However, the Sharpe Ratio should not be considered independently. A fund with a higher Sharpe Ratio may still not be suitable if its investment style does not match your risk tolerance or financial goals.
Investors should evaluate Sharpe Ratio along with other measures such as Sortino Ratio, Alpha, Beta, volatility, and portfolio characteristics.
5. What is the difference between Sharpe Ratio and Sortino Ratio?
The Sharpe Ratio measures a fund’s return compared with its overall volatility, including both positive and negative fluctuations.
The Sortino Ratio focuses only on downside volatility and measures how efficiently a fund generated returns while managing negative movements.
In simple terms:
Sharpe Ratio: Measures return efficiency against total risk.
Sortino Ratio: Measures return efficiency against harmful downside risk.
Both metrics are useful when comparing similar mutual funds.
6. Should I compare mutual funds from different categories?
No. Mutual funds should generally be compared only within the same category.
For example, comparing a Mid Cap fund with a Large Cap fund or a Debt fund may lead to incorrect conclusions because each category has different objectives, risks, and expected returns.
A better approach is:
– Compare Mid Cap funds with other Mid Cap funds
– Compare Large Cap funds with other Large Cap funds
– Compare Debt funds with similar debt categories
This creates a fair comparison.
7. How often should I review my mutual fund investments?
Investors should review their mutual fund investments periodically, usually once or twice a year, rather than reacting to short-term market movements.
A review should focus on:
– Changes in fund management
– Changes in investment strategy
– Significant portfolio changes
– Long-term performance consistency
– Whether the fund still matches your financial goals
Frequent switching based on short-term returns can negatively affect long-term wealth creation.
8. Are Value Research ratings enough to select a mutual fund?
No. Value Research ratings can be a useful starting point, but they should not be the only reason to invest in a mutual fund.
Ratings are based on historical performance and quantitative factors, but investors should also consider:
– Investment horizon
– Risk tolerance
– Financial goals
– Portfolio structure
– Expense ratio
– Risk-adjusted performance
A complete analysis requires looking beyond ratings and understanding how the fund generated its returns.
9. What metrics should I check before investing in a mutual fund?
Before investing in a mutual fund, investors should evaluate multiple factors, including:
– Long-term returns
– Benchmark performance
– Expense ratio
– Fund manager experience
– Portfolio diversification
– Sharpe Ratio
– Sortino Ratio
– Alpha
– Beta
– Standard Deviation
– Downside protection
No single metric can identify the best fund. A combination of return, risk, and portfolio analysis provides a more complete picture.
10. Can a fund with lower returns be a better investment?
Yes. A fund with slightly lower returns can sometimes be a better choice if it achieved those returns with lower volatility and better downside protection.
For example, a fund that delivers 16% returns with lower risk may provide a better investment experience compared with a fund that delivers 18% returns with significantly higher volatility.
The goal is not only to maximize returns but to achieve an efficient balance between return and risk.
📚 Glossary: Key Mutual Fund Terms You Should Know to Compare Mutual Funds
1. Risk-Adjusted Return: Risk-adjusted return measures how much return a mutual fund generated compared with the level of risk taken to achieve that return. It helps investors compare whether a fund’s performance was efficient rather than simply looking at the highest returns.
2. Sharpe Ratio: The Sharpe Ratio measures the additional return generated by a mutual fund for every unit of total risk taken. A higher Sharpe Ratio generally indicates that a fund has delivered better returns relative to its volatility.
3. Sortino Ratio: The Sortino Ratio evaluates a fund’s return compared with only its downside risk. Unlike the Sharpe Ratio, it focuses on harmful volatility caused by losses and helps investors understand downside protection.
4. Alpha: Alpha measures the excess return generated by a mutual fund compared with its benchmark after adjusting for risk. A positive Alpha indicates that the fund has historically added value beyond what would be expected from market movements.
5. Beta: Beta measures how sensitive a mutual fund is compared with its benchmark. A Beta above 1 indicates that the fund may move more than the market, while a Beta below 1 suggests lower sensitivity to market movements.
6. Standard Deviation: Standard Deviation measures the volatility of a mutual fund’s returns. A higher standard deviation indicates larger fluctuations, while a lower standard deviation generally suggests a smoother return pattern.
7. Expense Ratio: The Expense Ratio is the annual fee charged by a mutual fund for managing the scheme. A lower expense ratio can benefit investors over the long term because more of the investment remains invested and compounds.
8. Assets Under Management (AUM): Assets Under Management (AUM) represents the total value of investments managed by a mutual fund scheme. A healthy AUM indicates the size of the fund, but a larger AUM alone does not guarantee better performance.
9. Benchmark Index: A Benchmark Index is a standard market index used to evaluate a mutual fund’s performance. For example, a Mid Cap fund may be compared against a Mid Cap benchmark index to determine whether it has generated returns above the market segment it represents.
10. Downside Capture Ratio: Downside Capture Ratio shows how much a mutual fund falls compared with its benchmark during declining markets. A lower downside capture ratio generally indicates that the fund has provided better protection during market downturns.
🚀 What to Read Next
➡️ Mutual Fund Selection Checklist: Put Everything Together – Download & Use (Excel/PDF)
⬅️ How to Shortlist Mutual Funds Using AMFI Data
🌱 New to Mutual Funds? Start Your Mutual Fund Investing Journey Now
📚 Explore Mutual Funds Articles & Guides
🏛️ Learn Investing, Build Wealth, and Achieve Financial Freedom
- Why Use Value Research Mutual Fund Screener After AMFI Screening?
- Step 1: Open the Value Research Mutual Fund Screener
- Step 2: Set Up Your Fund Comparison
- Step 3: Compare the Snapshot
- Step 4: Compare Historical Returns
- Step 5: Compare the Portfolio
- Step 6: Compare Risk-Adjusted Performance
- Step 7: Final Comparison and Shortlisting the Best Mid Cap Funds
- The Complete Mutual Fund Selection Framework
- Final Thoughts
- 📖 Next Read: Mutual Fund Selection Checklist: Put Everything Together
- ❓ Frequently Asked Questions (FAQs) About Value Research Mutual Fund Screener
- 📚 Glossary: Key Mutual Fund Terms You Should Know to Compare Mutual Funds
- 🚀 What to Read Next
 Disclaimer
The information provided on this website is purely for educational and informational purposes only and should not be construed as financial, investment, tax, or legal advice. Investments in securities markets are subject to market risks. Please read all related documents carefully before investing. Past performance is not indicative of future results. Users are advised to consult their financial advisor before making any investment decisions.